The science of aging well
28 March 2011A strategic planning economic analysis aims to put a price on different possible steam generator repair options. It considers both technical and economic factors, and estimates the results of uncertainties
A pressurized water reactor (PWR) power plant uses steam generators (SGs) to transfer heat from the reactor coolant water to the secondary coolant water to produce steam. SGs are very important components of a PWR plant. Each SG has a tube bundle consisting of several thousand tubes which facilitates the transfer of heat between the primary side water inside the tubes and the secondary side mixture of water and steam outside the tubes. The secondary coolant feed water enters the SG between 400°F (204°C) and 450°F (232°C) and leaves as steam.
Even though SGs are passive components (no moving parts), plant operating history has shown that they experience degradation over time thereby affecting their function. The most limiting degradation has been to the heat transfer tubes. Many plants have replaced the original SGs at considerable expense. Evolutionary improvements in the design and material of construction have resulted in significant improvements in the reliability of the current generation SGs. However, it is very important to inspect and maintain the SGs to assure reliability and optimum performance over long periods.
An SG strategic management program proactively maintains the safety and reliability of the SG as a plant ages, or as it enters into an extended life. Economic, performance, and safety concerns place increased emphasis on proactive and preventive approaches to SG reliability. Budget and schedule constraints demand that utilities have a detailed plan to consider various options to address reliability and maintenance concerns, or eventual replacement.
The SG strategic planning process involves the systematic evaluation of operation and maintenance (O&M) options and alternatives. The process takes into account such technical and economic factors as plant operating conditions, corrosion degradation projections, inspection practices, repair options, secondary-side cleaning strategies, outage planning, unscheduled outages, and replacement options. When the strategic management input has been analyzed from both technical and budgetary perspectives, recommendations are developed that maximize plant availability within budgetary constraints. Moreover, it is a ‘living strategy’ that is continually reviewed and revised based on changing technical developments and fiscal considerations.
The strategic planning model assists in making decisions that can have large economic consequences and have uncertainties associated with the outcome of alternate courses of action. Probabilistic and statistical methods provide a quantitative assessment of the impact of the uncertainties on probable outcomes. This provides a quantitative basis to support utility decision-making from a long-term perspective while optimizing the net present value of cash flow.
Making the right decision
Westinghouse has developed and used a computer model dedicated to SG decision analysis. The model, first developed 20 years ago, has been adapted to the needs of several plants to weigh alternative O&M strategies. The model evaluates the net present value of cash flow resulting from the interplay of an ageing management activity and its costs and consequences. It is used to determine the most cost-effective solutions to ageing issues and the optimal time to apply these solutions.
The cost categories below are evaluated over a few likely scenarios:
- The major cost is for outage services including inspection, plugging, repairs such as sleeving, cleaning such as sludge lancing and chemical cleaning, and related outage activities. The model also accounts for radiation exposure and its associated costs.
- The cost of replacement power in the event of an outage extension can be significant. The duration of SG services during an outage is calculated and compared to the SG service window (the minimum time available to perform such actions to place them on the critical path). The difference determines the outage extension duration to calculate the replacement power cost for each outage.
- The loss in revenue from a decrease in electric power output resulting from SG performance degradation can be substantial. As more tubes are plugged or sleeved, steam pressure—and electric output—decreases. This is particularly significant when the pressure falls below the full load turbine valve wide open (VWO) pressure. Any decrease in electric power output from the current level is used to calculate the replacement power cost for future operating cycles. On the other hand, an increase in electric output (for example, due to returning tubes to service by sleeving, chemical cleaning to reduce fouling, SG replacement, plant uprating, an increase in T-hot limit, or other enhancements) is treated as a negative cost, reflecting its favourable impact on the analysis.
- The frequency and duration of mid-cycle outages attributable to the SGs are used to estimate the mid-cycle outage cost. A mid-cycle outage can occur due to an unexpected tube leak or for a SG inspection required by regulatory authorities. The cost of a forced or mid-cycle outage includes the costs of SG services and the cost of replacement power for the duration of the outage.
An illustration of the economic analysis
The strategic planning analysis process involves many technical and economic considerations such as plant operating conditions, chemistry control strategies, tube degradation projections, repair options, SG performance, electric power output, outage durations, unscheduled outages and replacement options.
A plant-specific SG strategic analysis includes informative graphs and tabular data comparing results for the principal O&M scenarios evaluated. In the final report of a typical analysis there may be six to ten scenarios; however, there typically are some refinement of the scenarios between the start of the analysis and the final set. Examples are used for illustrative purpose here. These comparisons may include tube plugging versus time, plant electric output versus time, SG outage service durations versus time and the present value of revenue requirements (costs) for each scenario (i.e., strategy). The SGs in this example are projected to have low tube degradation in the future which affects the scenarios selected for evaluation.
The example includes the following five scenarios (Figure 1):
- Scenario 1M: In-bundle upper bundle hydraulic cleaning (UBHC) to remove flow-blocking deposits from upper support plates
- Scenario 2M: Advanced scale conditioning agent (ASCA) application every three cycles
- Scenario 3M: High pH operation to reduce iron ingress into SGs
- Scenario 4M: High pH operation and ASCA application every six cycles
- Scenario 5M: Chemical cleaning
All scenarios include sludge lancing (SL) and foreign object search and retrieval (FOSAR) during every refueling outage. The notations 3R37, 3R38, etc. in the figure refer to specific future outages of this unit. CECIL stands for Consolidated Edison Combined Inspection and Lancing system. It was developed by the US utility of the same name.
Tube degradation model
Management of SG tube degradation and thermal performance is a key aspect of the strategic evaluation. The analyses make individual repair estimates for different degradation mechanisms. The present state of the art does not permit a calculation of tube degradation on
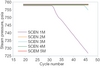
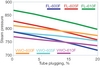
a first principles basis. Rather, the evaluation requires engineering judgment to project the plant trend for the observed and potential degradation mechanisms. Future tube degradation estimates are based on the experiences of plants with similar tubing as well as overall SG design and on laboratory data. These estimates are combined statistically to obtain the aggregate repair estimate as a function of time. Tube plugging projections developed for this example is shown in Figure 2.
The base degradation estimate assumes that no significant change in plant operation occurs. Also, in this simple example it was assumed that the actions taken in different scenarios will not impact the tube degradation projection; future plugging level remains the same in all scenarios. Changes in plant operation such as secondary water chemistry control, primary coolant operating temperature and power rating require an adjustment of the tube plugging projection.
Turbine generator performance is modeled using a simplified ‘turbine curve’ showing electric output versus steam pressure. Note in Figure 3 that there is a distinctly higher slope below the valve wide open (VWO) pressure (750 psia). Thus, a decrease in steam pressure at the VWO condition results in a significant reduction in plant electric output.
SG performance model
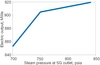
Steam generator performance is modeled by four graphs. Two of the graphs plot tube plugging and primary coolant inlet temperature T-hot as independent variables, and steam pressure as the dependent variable for each of the future operating cycles, as depicted in Figure 4. Full load steam pressure calculations are made for different plugging levels and T-hot, each combination yielding a steam pressure; the resulting table defines the SG performance at full load (FL). The evaluation is repeated for VWO condition (the reactor load will vary with pressure to maintain a VWO condition); the resulting table defines the SG performance at VWO. Similarly, the other two graphs (not displayed) chart the change in steam pressure versus fouling factor for the full load and VWO conditions.
Figure 4 displays two sets of parametric evaluations of SG performance for full load and for turbine valve wide open condition. The primary coolant inlet temperature (in degrees Fahrenheit) to the SG is the parameter 600, 605 and 610. Interpolation is used to determine the steam pressure at intermediate values. At steam pressures above the point of intersection of the FL and VWO curves of a given T-hot (for example, 600°F), the FL curve will govern (steam pressure will be determined by this curve) whereas at lower pressures, the VWO curve will govern. For the 605°F and 610°F, the points of intersection between the FL and VWO curves fall further to the right of the data in the figure (when plugging is above 20%).
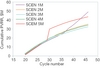
The analysis permits increases in T-hot if necessary to maintain the desired steam pressure, without exceeding the specified T-hot limit. Figure 5 shows the projected steam pressure as a function of future operating cycle in the example.
Calculations are performed one cycle at a time for each of the future cycles. Cost escalation rates in future years are specified as an input, and the escalation rates are applied in the calculation of future costs. The present values of the future costs are calculated using the present value discount rate specified by the utility. The calculations are repeated for each of the scenarios.
Cost models
- Operating Cost Model: The change in the operating cost in a cycle = the decrease in plant electric output from reference point X the cycle duration X the average capacity factor during plant operation X replacement power cost.
- Planned Outage Cost Model: Planned outage cost for a cycle = the total costs of planned SG outage services + radiation exposure costs for SG services + replacement power cost, if outage extension is required due to SG activities.
- Forced Outage Cost Model: The forced outage cost in a cycle = the frequency of the forced outage during the cycle X the duration in hours of the forced outage X the plant’s electric output X the capacity factor X the cost of replacement power + the cost of the SG services during the forced outage.
The flexibility of the computer code permits the use of a variety of forced (or mid-cycle) outage models. We have used three different forced outage models for different evaluations as per customer preference.
The Bayesian model defines several causes of a forced outage with frequency estimated dependent on plant-specific and industry history. Though it is objective, the drawback to this approach is that it is based on past history and therefore ignores advances in SG-related forced outages. A second model is based on tube degradation: Forced outage frequency and timing depend on the tube repair estimates. A forced outage is triggered by pre-established tube repair thresholds. A third model uses expert opinion on frequency and timing of forced outages. The last two models are simple, but subjective.
Scenario development and evaluation
For the SG strategic planning evaluation, an O&M scenario is defined as a specific outage-by-outage listing of planned activities which may include repairs, modifications, or other appropriate actions over the duration of the planning horizon.
The evaluation period for the scenarios is specified by the utility; however, it is recommended that the 40-year operating license duration is used. Since most plants are planning to extend the license an additional 20 years, it is appropriate to include the expected license extension in the planning horizon.
The first few scenarios evaluated usually yield insight into the process and many of the significant factors and their technical and economic impacts. Subsequent iterations lead to the selection of ‘improved’ scenarios. After the analysis of various O&M options, additional evaluations may be made to optimize the cycle-by-cycle timing of specific actions such as SG replacement. The computer model makes it easy to incorporate changes during the evaluation.
Maintenance, repair, and modification options include tube plugging, sleeving, turbine modifications to accommodate reduced steam pressure, power uprating, SG replacement, corrosion inhibitor additions, and so on. Where appropriate, revised tube degradation rates are incorporated into post-repair projections for the degradation mechanisms affected by the repair. Typical assessment includes evaluation and documentation of several alternate O&M scenarios for the plant.
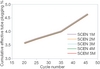
Figures 5, 6, and 7 indicate results of the strategic analysis for the example. In Figures 5&6, the scenario 1 action is not effective in addressing the underlying issue of fouling and as a result the steam pressure continues to decrease over time, thereby reducing electric output and revenue. That said, the conclusions from the example should not be taken as universally applicable. Plant-specific evaluation should be conducted to assess the impact on a given plant. The methodology is generically applicable, but significant caution should be applied in drawing specific conclusions based on a simplified example analysis.
Figure 7 shows the cumulative present value of revenue requirements (PVRR). The PVRR value at the end of the planning horizon accounts for all of the relevant costs and is the ‘bottom line’ for each scenario. This value for each scenario may be compared with those of the other scenarios in order to select the most cost-effective strategy. It should be noted from Figure 7 that if the evaluation was carried out for a shorter planning horizon, then the results would extend only to the corresponding point in time and the right hand portions of the curves beyond this point would be absent. Hence, it is very important that the evaluation should extend to the end of the expected plant life.
Sensitivity and uncertainty analyses
The extent of uncertainty in the input variables used in the evaluation varies from one variable to another. From prior experience, tube degradation projections have the highest level of uncertainty. For this reason, in normal practice, the analysis pays closer attention to this variable. In addition to the median estimates, upper and lower decile tube repair estimates are made. The upper decile implies that there is a 90 percent probability that the actual degradation will be less than the upper decile repair estimate and the lower decile implies a 10 percent probability that the actual degradation will be less than the lower decile estimate. The evaluation of the scenarios is repeated for the upper and lower decile tube repair estimates. The results (cumulative PVRR) are then combined and weighted to calculate the expected value. A 50 percent weight is applied to the PVRR from the median estimate and 25 percent weights to the PVRR from each of the upper and lower decile estimates.
Sensitivity evaluation is performed for several other variables having moderate levels of uncertainty. These might include present value discount rate, escalation rate, replacement power costs, and mid-cycle outage frequency, and/or duration.
Individual pieces of the model, such as SG performance and turbine generator performance, are validated. The decision evaluation methodology is consistent with financial decision theory. However, there are predictions used such as future escalation rates and present value discount rate which are uncertain. The most important of these are the tube degradation rates. Validation of the whole model faces the challenge that when a plant selects a given scenario to follow, comparison of the outcome with other scenarios is no longer possible.
The final strategic plan report includes the basis and results of the tube degradation estimates used in the evaluation, the strategic planning methodology and models, descriptions of the O&M scenarios, sensitivity and uncertainty evaluations, and suggested alternatives. The scenario with the lowest cumulative PVRR will typically be the optimum strategy.
Simply put, SG strategic planning provides the basis for making sound decisions from a long-term perspective. The analysis defines actions to increase SG reliability, reduce operating and maintenance costs, and increase the value of this critical plant asset from a long-term perspective. It transforms the art of ageing well into a science.
TablesFigure 1: summary of maintenance scenarios