Fukushima Daiichi crisis: Analysis
Simulating an SBO
15 August 2011Simulation of a station blackout at the Kuosheng NPP, a BWR-6 plant in northern Taiwan, has shown that plant-specific features may overcome RPV depressurization strategies determined by simple mathematical models. Depressurisation parameters, RPV water level and number of relief valves opened are studied in a sensitivity analysis. By Chih-Ming Tsai and Shih-Jen Wang
Station blackout (SBO) is one of the most challenging severe accidents for a boiling water reactor (BWR), as illustrated recently at Fukushima Daiichi in Japan. In order to mitigate accident consequences the BWR owners’ group (BWROG) developed emergency and severe accident guidelines in BWR plants in 1997 [9]. These documents were updated in 2001 [10]. In 2003, Taiwan completed the severe accident management guidelines (SAMG) for its two BWRs, Chinshan and Kuosheng [11, 12] (it also has a two-unit PWR at Maanshan).
These guidelines recommend that all safety relief valves (S/RVs) should be opened for emergency depressurization of the RPV, the reactor pressure vessel. (Depressurization is required so that low-pressure water can be injected into the vessel to cover the core). However, this means that the core water would rapidly reduce with continued vaporization. In cases where the recovery of offsite power can’t be guaranteed, optimizing the utility of water in the reactor pressure vessel is a straightforward way to prolong vessel integrity while avoiding the effects of high pressure melt ejection (HPME) and direct containment heating (DCH).
In order to address this, a sensitivity analysis has been carried out for emergency depressurization. The study, carried out by the Institute of Nuclear Energy Research, looks at the effectiveness of emergency depressurization with the opening of a varying number of RVs. It also looks at the relationship between RPV life and the RPV?water level for depressurisation.
Description of Kuosheng
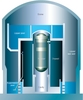
Kuosheng nuclear power plant in northern Taiwan is a two-unit General Electric BWR-6 with Mark-III containment. Its reactors have a rated core power of 2894 MWt and a net electrical output of 985 MWe. The core contains 624 fuel bundles and 145 control rods. The containment is a reinforced concrete cylinder with a hemispherical dome and includes the drywell, the wetwell, and the reactor building. A spray and fan cooler system is equipped to control the containment pressure and temperature. The free volume in the drywell is 6.74x10³ m3, wetwell (including suppression pool) is 3.17x10³ m3 and reactor building is 4.41x10⁴ m3 [5]. The design pressure of the wetwell is 0.205 MPa.
The reactor cooling system (RCS) consists of two recirculation loops and operates at 7.22 MPa. Each loop has a recirculation pump. There are 16 S/RVs, which are normally closed, distributed at the four main steam lines with different set points. The automatic depressurization system (ADS) consists of seven S/RVs, which could depressurize the RCS pressure to allow the emergency core cooling system (ECCS) water to enter the core. The ECCS includes a high-pressure core spray (HPCS) system, a low-pressure core spray (LPCS) system, a low-pressure core injection (LPCI) system, and three loops of a residual heat removal (RHR) system for low-pressure injection and recirculation. One of the RHR loops is used for suppression pool cooling.
A fifth emergency diesel generator is equipped at Kuosheng NPP to increase the reliability of electrical power. There are water tanks, and fire trucks can inject cooling water into the reactor vessel or containment via an RHR loop. Igniters for hydrogen gas in containment are equipped with alternate diesel power in case of SBO.
Station blackout
The loss of AC and DC power is assumed to occur at the start of the SBO simulation. The reactor SCRAM follows with the coast-down of reactor feedwater pumps (RFPs) and reactor cooling pumps (RCPs) tripped. Feedwater is quickly reduced to zero. The turbine stop valves (TSVs) and main steam isolation valves (MSIVs) are also closed. HPCS, LPCI and LPCS are unavailable. Without recovery of power or equipment, the transient proceeds to severe core damage and melting. The sequence of events is shown in Table 1. The corresponding major plant responses are shown in Figs. 2 through 8.
Pressure
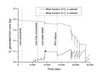
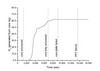
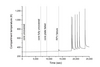
The SBO accident was initiated at 0s. The reactor power decreased rapidly to radionuclide decay power as the reactor SCRAMmed. The turbine steam flow rate reduced to zero as the TSVs closed. The in-vessel pressure and temperature increased as the water in the RPV was heated by the decay power. When the pressure set-point was challenged, the RVs cycle for pressure control. Fig. 2 shows the RPV pressure in response to the RVs cycling. The RPV pressure significantly depressurized at 13,593s as the instrument tube failed at high pressure melt ejection (HPME) mode.
Water level
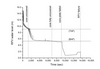
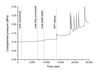
The response of RPV water level is shown in Fig. 3. Since the steam was dumped to the wetwell through RVs, the RPV water level decreased monotonically to the top
of the active fuel (TAF) at 1300 s and eventually reached the bottom of active fuel (BAF) at 6817 s. After the core plate failed at 9113 s, the rest of water inventory flushed to steam.
Core temperature
As the RPV water level fell below the TAF, the cladding temperature dramatically increased as the heat sink of the fuel deceased. The cladding temperature at the uncovered fuel rod increased earlier than those at the covered regions. The responses of maximum and average core temperature are shown in Fig. 4. As the cladding temperature exceeded 1100 K at 2710 s, the reaction of cladding oxidation began and hydrogen was generated as shown in Fig. 5. In total 62.5 kg hydrogen was generated from the core.
Hydrogen
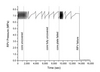
The hydrogen from the core was released to the wetwell through the S/RVs, then to the upper wetwell, lower dome, and upper dome. Hydrogen burning occurred when the hydrogen concentration exceeded the ignition limit. Fig. 6 shows the mole fractions of H2 and O2 in the wetwell. The burnings resulted in pressure and temperature peaks, as shown in Figs. 7 and 8, respectively
As HPME occurs, the debris is brought to the free air volume of the containment in the form of particles. The decay power from the radionuclides causes DCH. The DCH may result in rising temperature and pressures in compartments to challenge containment design limits. The BWROG thus recommends that at the start of SBO accident the plant depressurize the RPV by opening all S/RVs under emergency operating procedures (EOP).
Simulation
Historically, computer codes such as MELCOR [1] and the modular accident analysis program (MAAP) [2] have been used to simulate severe accidents in light water reactors. In Taiwan, for example, the accident sequences in a large-break loss of coolant accident (LOCA) at Kuosheng NPP and station blackout accident at Maanshan NPP have been studied using MELCOR and MAAP [3-8]. Both tools give similar simulation results for important phenomena, while MAAP is faster-running.
In this study the MAAP5 code is used to simulate the sequence of events in the SBO accident. The Kuosheng NPP is exemplified and the sensitive parameters of emergency depressurization in SBO accident are studied.
A sensitivity analysis of two parameters, the RPV water level and the number of RVs opened in emergency depressurization has been carried out. Because the TAF and BAF are 9.11 m and 5.30 m from the bottom of the RPV, respectively, the spectrum of RPV water level is bounded from 5.3 m to 9.1 m. The bounds of RVs opened are set as one to all (nine valves). The corresponding effects on the RPV life and appearance of HPME and DCH are studied as follows.
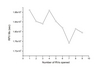
The effectiveness of the number of RVs opened for emergency depressurization at the RPV water level of 9.1 m is studied. Fig. 11 shows the relation of RPV life versus the number of RVs opened. The results show that the water inventory in the vessel ran out earlier as more RVs opened in depressurization. Although opening more RVs could accomplish a larger contribution of steam cooling, such cooling might possibly be followed by an early core melt. As shown in Fig. 11, opening one RV is recommended. It is also demonstrated that emergency depressurization is essential in an SBO accident, since HPME and DCH are eliminated in all cases, but opening more RVs doesn’t have a deterministic contribution to RPV life.
Conclusions
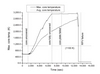
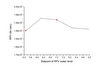
The effectiveness of the RPV water level at prolonging the life of the RPV in the case of emergency depressurization is studied. The water level between 5.3 m and 9.1 m is divided regularly into five levels. Fig. 12 shows the dependence of RPV life on water level for emergency depressurization. From it, one can conclude that delaying the depressurization could prolong water inventory in the RPV and maintain vessel integrity longer. Depressurizing the RPV at the relatively low water level of 6.2 m could maintain vessel integrity the longest (5.39 hours). However, if the depressurization is introduced too late—such as at 5.3 m—the cumulative impacts on the vessel and core may be as large as the HPME effects cannot be avoided.
Conclusions
In this research, the effects of the RPV water level and number of RVs opened for emergency depressurization on the vessel life and appearance of HPME and DCH effects are studied. The results in sensitivity analysis of the number of RVs opened demonstrate the depressurization is essential to eliminate HPME and DCH effects. But opening more RVs has no deterministic contribution to preserving reactor life. In terms of RPV water level, delaying depressurization has a positive contribution on RPV integrity, but a negative impact from greatly delaying the introduction of steam cooling.
In the future, an optimization algorithm combined with the MAAP5 code would be used to identify the optimal strategy for emergency depressurization to prolong the vessel integrity as well as eliminating HPME and DCH effects. It is expected that the optimization algorithm can provide the best use of available water in the RPV until the plant power or equipment is recovered.
| Similarities and differences to the Fukushima Daiichi situation |
| The earthquake and tsunami are natural catastrophes of historic proportions that have combined to cause great damage to Japan. The reactors at the Fukushima Daiichi plant were immediately scrammed when the earthquake first hit. The diesel generators started to provide backup electric power to the plant’s backup cooling system. After approximately one hour the diesel generators ceased functioning due to tsunami-induced damage to their fuel supply. When the seawater swept away the power lines, all external power to the station was lost. DC power from batteries was consumed after approximately eight hours. The plant was then experiencing a long-term SBO accident. |
| Mapping MAAP |
| The modular accident analysis program (MAAP) was developed by Fauske & Associates Inc. The new MAAP5 computer code (including the MAAP5-GRAAPH graphical interface) [18] improves the MAAP4 code. The software can simulate the response of LWR NPPs during severe accident sequences, including mitigating actions in accident management. The entire spectra of severe accident phenomena, including core heat-up, degradation and relocation, lower plenum phenomenology, corium-concrete interactions, containment hydraulics, hydrogen combustion, radionuclide release and transport, etc. are treated in MAAP5. All of the control volumes of the plant, including reactor vessel, steam generator (S/G), containment, emergency core cooling system and its associated control logic, are provided. It provides a flexible, efficient, integrated tool for evaluating the in-plant effects of a wide range of postulated accidents and for examining the impact of operator accident on accident progressions. The advanced BWRs are also included, such as the simulation of passive flooder, containment overpressure protection system and so on. |
| References |
| 1. GE, BWROG EPGs/SAGs. (1997). |