Using UT to assess neutron-induced damage
-
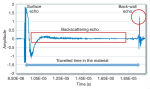
Figure 1b: a trace of a scan showing ultrasonic signal interactions with... -
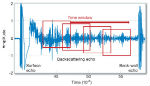
Figure 2: Display of the ultrasonic signal in the time domain -
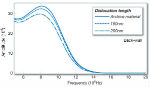
Figure 9: Frequency spectrum change in the back-wall echo due to dislocations -
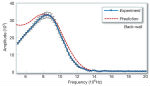
Figure 3: Comparison of predicted and experimentally-obtained spectra of... -
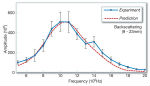
Figure 4: Comparison of predicted and experimentally-obtained spectra of... -
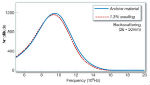
Figure 6: Frequency spectrum change in the backscattering echo in the region... -
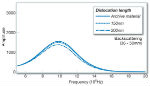
Figure 10: Frequency spectrum change in the backscattering echo in the region... -
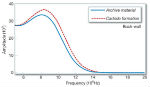
Figure 7: Frequency spectrum change in the back-wall echo due to homogeneous... -
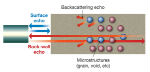
Figure 1a: Schematic images of ultrasonic signal interactions with... -
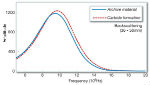
Figure 8: Frequency spectrum change in the backscattering echo in the region... -
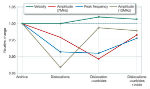
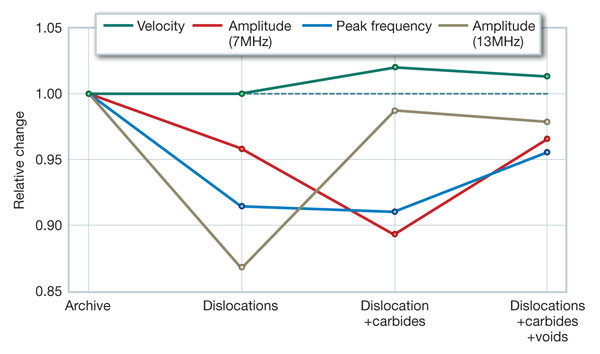
Figure 12: Some possible indicators that can be used to identify... -
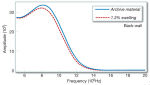
Figure 5: Frequency spectrum change in the back-wall echo due to... -
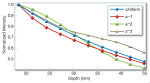
Figure 11: Plots of 5-10 MHz frequency spectra vs depth for each case....