Fukushima Daiichi crisis: Instrumentation & control
Preventing accidents through automation
20 April 2012If automatic, state-of-the-art safety controls were used at Fukushima Daiichi, both the meltdown and the hydrogen explosions could have been prevented. By Béla Lipták
The tsunami waves generated by Japan's 11 March 2011 Great Eastern earthquake took an hour to reach shore. In this one-hour window of opportunity, the Fukushima Daiichi reactor units should have been automatically flooded with cooling water. Electricity for these pumps was still available; it was the tsunami, not the earthquake, that knocked out site power.
After the tsunami hit the plant, there was another five-hour window of opportunity to prevent meltdown. The cooling water pumps stopped at around 16:00 on 11 March 2011, when the water level in the unit 1 reactor was 4 metres above the top of the fuel rods. By 21:00 it had dropped 8 metres, fully uncovering the fuel. During that same time period, the core temperature increased from about 300°C to nearly 3000°C and by the morning of 12 March the reactor core melted, dropped to the bottom of the reactor’s containment vessel and probably burned a hole into its wall.
In spite of various other design deficiencies, meltdown could have been prevented if the plant was provided with properly automated safety controls. I will describe the automatic control systems that would have prevented the Fukushima accident and point to both the specific control system issues and to the unsafe nature of depending on manual operator response to unsafe conditions.
In case of Fukushima these included:
(1) The delayed injection of freshwater (12 March at 05:50) and later seawater (12 March at 20:00), after the cooling water pumps stopped some 14 hours earlier at around 4 pm on 11 March. This delay, caused by hesitation of the operators, would not have occurred under automatic control.
(2) The 4-week delay (11 March to 7 April) of starting the nitrogen purging of the primary containment vessel.
(3) The delay in relieving the excessive hydrogen and steam pressure outside the building. In case of Fukushima, relief was initiated manually and only after a delay of seven hours.
Naturally, it is essential that the operators trust the various sensors and alarms at a nuclear power plant. Therefore, they must be redundant and reliable. This was not the case at Fukushima. In the reactor, water levels were not reliably measured, but were only assumed to be correct by the operators. False readings suggested that water levels were several metres above the actual and in the primary containment vessels they were not even measured. To prevent the Fukushima accident, an alternative automated plant design is envisaged in which detectors monitoring critical variables would be reliable and accurate, and would be triple-redundant, configured in a voting arrangement, so that if one sensor disagrees with the ‘majority,’ its reading is immediately disregarded and its recalibration is requested automatically.
Unreliable measurement
Operators must know if the fuel rods are covered with water or not, and safe plant operation requires automatic response if this level drops too low. This requires reliable level measurement! Today we know that the operators assumed water levels to be much higher than they really were. This was only discovered two months after the incident (in May), when the water level gauge for the reactor was calibrated.
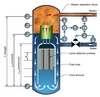
Figure 1 shows a boiling water reactor and the traditional method of measuring the level in many existing BWRs. A BWR reactor is designed so that its core is surrounded by a shroud. The cooling water enters into the ‘jacket-like’ space between the shroud and the wall of the reactor. The water travels down the outside of the core and then rises up inside it. As it rises, the fuel rods heat it and it starts to boil. As steam bubbles form, the steam-to-water ratio rises and the water ‘swells.’

The goal of the level control system is to keep the fuel rods always covered to protect them against overheating and melting. In many BWRs, the water level and the steam/water ratios (S/W) are not measured inside the core. Instead, they are measured ‘ex-core,’ between the shroud and the reactor wall. Under emergency conditions (when the ex-core water level drops below the suction of the jet disperser, because the cooling water pumps have stopped) this measurement no longer reflects the water level inside the core. Consequently, ex-core level measurement can be useless during loss-of-cooling emergencies.
In most nuclear power plants, the level outside the shroud is measured over two ranges, a narrow (LT-N) one and a wide (LT-W) one. The narrow span transmitter (LT-N) is more sensitive and is a better indicator of the level of the boiling water surface while the wide range transmitter (LT-W) detects the total hydrostatic head in the reactor (the collapsed level). Almost without exception, they both are of the differential pressure (d/p) type hydrostatic designs, installed with condensate pots, which provide water-filled reference legs (‘wet legs’) to the high pressure sides of the d/p cells. In order to cool and thereby condense the steam, the condensate pots are usually uninsulated, and the condensate drains back into the reactor through a sloping connecting pipe from the side of the pot.
The level transmitters shown in Figure 1 are inverse-acting (the reference leg is connected to their high-pressure side), and therefore, a maximum level produces a zero-differential reading, while a zero level causes a maximum output signal. The measurement also depends on the assumption that the wet leg is full of condensate at ambient temperature. During an accident, neither of these assumptions is necessarily correct. In fact, they are likely to be wrong, because once the level in the reactor drops below the low-pressure tap of LT-N, its pressure difference reading drops to zero and therefore the level is no longer known. It no longer measures anything.
Also, because the water in the reactor is boiling, these d/p cells detect the hydrostatic head (mass of water) and not the level. Swelling occurs when the steam pressure drops (the steaming rate increases), and shrinking occurs when the steaming rate is reduced (the steam pressure rises), and bubbles collapse. The more bubbles form (swelling), the higher is the boiling level, but lower is the density and therefore the detectors under-report the level. Inversely, as the steaming rate drops (shrink phase), the density increases, level drops, while the level measurement increases. In other words, when the surface of the boiling water rises (swelling) the level reading drops, and when the boiling rate is reduced and therefore the water level drops, the level reading rises.
Therefore, the d/p cell outputs can indicate the surface level only if the measurement is corrected for density. At Fukushima and at many American plants, this correction may not be made, or may be inaccurate. Therefore, these level measurements are unreliable or useless. Because of this, the level cannot be controlled automatically and is often left under manual control, which is unacceptable.
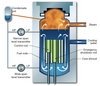
In the case of Fukushima (and in a few old American plants), the design is even worse, because no transmitters are used at all. Instead of transmitters, only d/p indicators are used, but even those are located far away, usually in the control room (Figure 2). What makes this design even worse is that the level gauge (LI) is connected to the reactor by long lead lines. These lines represent the high-pressure reference and are supposed to be filled with cold condensate from the condensate pot. However the condensate from these long lead lines can be lost due to leakage, the lines can be plugged, become blocked by air, or the water can oscillate in them. At Fukushima, the condensate pot temperature probably reached boiling point, the condensate in it evaporated and once the lead line was no longer full, the d/p indicator drastically over-reported the water level in the reactor by several metres. Therefore, the operators assumed that they had more water than they really did. This explains why they did not start water injection for some 14 hours, by which time the window of opportunity to prevent meltdown had gone.

Alternative set-up for reliable level measurement
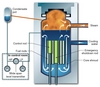
Measurements taken outside the core are an accurate indication of in-core water level only until the level drops to the suction of the jet pump diffuser. Therefore, under emergency conditions direct in-core measurement is also needed. The left of Figure 3 shows the set-up of sensors required to correctly measure the ex-core water levels. The red arrows show the flow direction of the steam and the blue arrows that of the water. The readings of the pressure transmitters P1, P2, etc. to PX can be used to measure the ex-core level and at the various levels the steam/water ratio. These pressure sensors should be installed at an equal vertical distance (A) from each other. The closer the sensors are (the smaller “A” is), the more precise the measurement. If in Figure 3 the difference between two readings is zero (P2-P1 = 0), it indicates that only steam is present at that elevation. A ?P reading above zero (P3-P2 > 0) indicates that some water is also present at that elevation.

By this method, the boiling surface (LS), which under normal operating conditions is on set point (LC = LS) can be estimated as being between the first detectors which measure a ?P above zero. Under normal operation, the resulting LC reading will be about the same as the one detected by LT-N in Figure 1 or LI in Figure 2. In addition, the various combinations of these pressures and differential pressure measurements (knowing the steam pressure (PS) and the specific gravity (SG) of water at the operating temperature), can be used to obtain the following information:
- Steam/water ratio (S/W) at any elevation A is S/W = ?P/(A)(SG).
- Collapsed total water level in the reactor (LTM). The total mass of water in the reactor is obtained if LTM is multiplied by the open cross-sectional area of the reactor: LTM = (PX – P1)/(AN)(SG).
- Total steam/water ratio S/W = (LTM)(SG)/(AN)(SG).
The ex-core level measurement will approximate the in-core level as long as the fuel rods are covered with water. Under emergency conditions, this is not the case, yet the accurate measurement of the in-core level is still needed. At Fukushima the level inside the core was not measured at all. This resulted in the uncertainty concerning the degree of meltdown and of the time of the start of hydrogen generation, which occurred about seven hours after the arrival of the tsunami.
As to the method of detecting the in-core water level, one method would be to measure the temperature and thermal conductivity or electric conductivity at the different elevations in the core (see purple probes shown in Figure 3). These measurements would reflect the steam/water ratio at different elevations, because the thermal conductivity of water is higher than that of steam.
David Nyce designed such a method for the Knolls Atomic Power Laboratory, a US government R&D facility that was dedicated to supporting the naval nuclear propulsion programme. Nyce used a series of metal probes of different lengths with ceramic insulation and equipped with two thermocouples each. Each probe had a heated thermocouple at its tip, and an unheated reference thermocouple at a distance (D = 0.15m) above the tip. In a simplistic example, the level range to be measured is 0-1.0m and the lengths of three probes are 0.75m, 0.50m, and 0.25m. Because the thermal conductivity of water is high, while the thermal conductivity of the steam is low, the temperature difference ?T between the readings at the tip and the reference thermocouple 0.15 m (D) distance above it will indicate if water or steam is present in that region. If water is present, the ?T will be low, if steam is present the ?T will be high.
As shown in the Table 1, using three probes results in four ‘level regions’ that can be distinguished. The water level is in the region with the lowest ‘low’ reading. Much larger ranges can be measured by changing the lengths of the probes, and higher precision can be obtained by increasing the number of the probes and/or reducing the distance D.
Another method to consider for the detection of in-core level is to correlate gamma radiation distribution inside and outside the reactor pressure vessel with the water level. The vertical gamma radiation distribution is related to water level, but because it is also a function of the neutron flux and the coolant recirculation pump speed, special algorithms are needed to interpret the level based on these radiation measurements.
To obtain fully-reliable measurements, it is also desirable to provide battery backup and wireless output for all the transmitters, so that if either the regular power supply fails, or the regular output signal wires are damaged, the level information will still be available and can be read not only in the control room, but also outside the building.
Preventing hydrogen explosions
Once the window of opportunity to keep the fuel rods covered was missed, the safety goal should have been to prevent the explosion of the hydrogen generated by the reaction of zirconium cladding and water.
At Fukushima, as the pressure increased, the radioactive steam containing hydrogen was relieved by a PSV into the wet well, but due to loss of cooling, the steam did not condense. Therefore the pressure built up until (seven hours later) operators finally relieved it by manually opening the vent valve. The hydrogen accumulated inside the building, mixed with oxygen in the air and exploded.
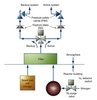
An automatic safety control system could have prevented the explosion. As soon as hydrogen was detected in the torus, an automatic backup cooling system would have been automatically actuated. If and when pressure continued to rise, a pressure relief system (Figure 4) would have automatically opened to relieve the steam-hydrogen mixture outside the building (after radionuclide filtration). In addition, nitrogen purging of the primary containment would have started automatically and immediately. (Fukushima operators did not inert the primary containment until two months later in May 2011).

One important feature of the design in Figure 4 is that as soon as the excess pressure is released, the pressure safety valve recloses. In case of the Fukushima (or any other plant where the vent valve is manually opened), the operator can forget to reclose the valve, leading to the unnecessary release of additional radioactive gases and solids. The main reason why the design of this system is safe is because it actuates automatically, so it does not rely on operators’ judgement.
Author Info:
Béla Lipták (liptakbela@aol.com), PE, president, Béla Lipták Associates, PC Automation and Safety Consultants, 84 Old N. Stamford Rd, Stamford CT. 06905, USA. www.BelaLiptakPE.com
A similar article by the same author appeared in the September 2011 issue of CONTROL, published by Putman Media Co, www.controlglobal.com. Also, for an explanation of how automation can protect nuclear power plants against cyber terrorism attacks, see www.tinyurl.com/7wygcr5
This article was published in the February 2012 issue of Nuclear Engineering International magazine.
TablesTable 1: Nyce water height determination by probe thermal conductivity